
How much should your company spend on demand generation?’ It sounds like a question that should have a straightforward answer. In practice, it rarely does. A company with reliable historical data can estimate its required investment using actual acquisition costs and conversion rates. However, a business entering a new market or launching its first demand generation campaign must rely more heavily on assumptions until it gathers enough performance data.
The answer depends on what you are trying to achieve, what a customer is worth, how efficiently your funnel converts, and how long revenue takes to materialize. It also depends on whether you already have historical data or are building your first serious program.
That is why copying an industry percentage or increasing last year’s spend by 10% is not enough. A demand generation budget should show how much pipeline the business needs, what it may cost to produce, where the money should go, and when the investment is likely to generate a return.
This guide walks through that process using practical calculations, a worked example, and a framework you can adjust to your own revenue targets and customer economics.
What Should a Demand Generation Budget Include?
Before deciding how much to invest, define what the budget needs to cover. Many businesses treat their paid media spend on platforms such as Google Ads and LinkedIn Ads as the full cost of demand generation. It is only one part of the investment.
Running an effective campaign also requires audience research, messaging, offers, landing pages, creative assets, tracking, and sales follow-up. If these supporting activities are excluded, the budget will appear more efficient than it really is and the projected return will be overstated.
A practical budgeting approach is to organize the investment across five cost areas:
Programs and distribution. Start by estimating the spend required for paid search, paid social, retargeting, content syndication, sponsorships, webinars, industry events, and partner campaigns.
Content and creativity. Set aside funding for research, articles, reports, case studies, videos, design, landing pages, and supporting campaign assets. It is also sensible to budget for testing and periodic creative refreshes as performance changes over time.
Technology and data. Factor in customer relationship management platforms, marketing automation, attribution, analytics, intent data, enrichment, and testing tools. The estimate should cover implementation and integration work alongside subscription fees.
People and outside expertise. Include internal marketing salaries, contractor fees, and the cost of any demand generation agency supporting strategy or execution. When assessing B2B demand generation services, compare the fees with the expense and capabilities required to build the same function internally.
Contingency. Keep part of the budget available for media price increases, creative revisions, promising campaign tests, or unexpected event opportunities. This gives the team room to respond when performance data points to a better investment opportunity.
Once the full cost is clear, divide the investment between capturing buyers who are already looking for a solution and reaching potential buyers before they enter an active purchasing process. A sound budget supports both instead of spending everything on immediate lead acquisition.
How to Calculate the Required Investment
Once you have identified everything the budget must cover, the next step is to calculate how much investment your revenue target requires. This calculation begins with four business metrics: the revenue marketing must support, average contract value, opportunity-to-win rate, and historical acquisition cost.
Together, these figures show how many customers the business needs, how much qualified pipeline must be generated, and what that level of acquisition is likely to cost. If reliable historical data is unavailable, use conservative assumptions and revise the forecast as performance data becomes available.
Decide How Much Revenue Marketing Must Support
Use the portion of new revenue that marketing is expected to source or support. Do not automatically use the company’s entire growth target. Existing-customer expansion, partner sales, and founder-led deals may sit outside marketing’s remit.
Assume marketing is responsible for supporting $3 million in new annual contract value. If the average first-year contract is $60,000, the company needs 50 new customers:
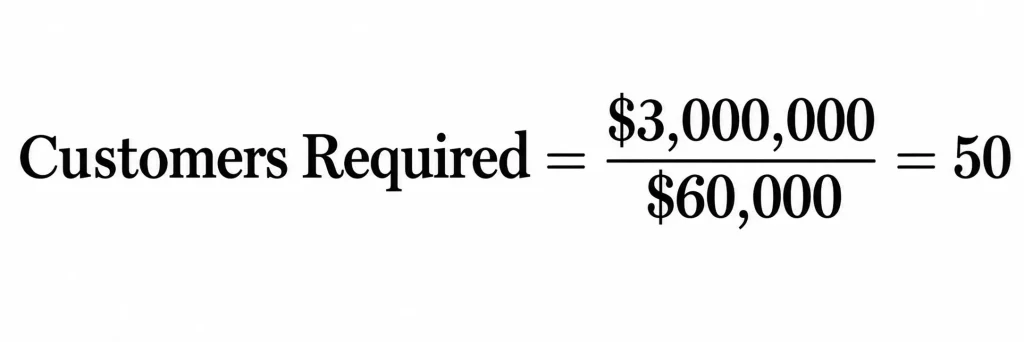
Use the contract value for the customers the campaign is meant to attract. Blending a handful of enterprise accounts with a large midmarket base can make the average look better than the actual campaign economics.
Work Back to Qualified Pipeline
Now apply the opportunity-to-win rate:
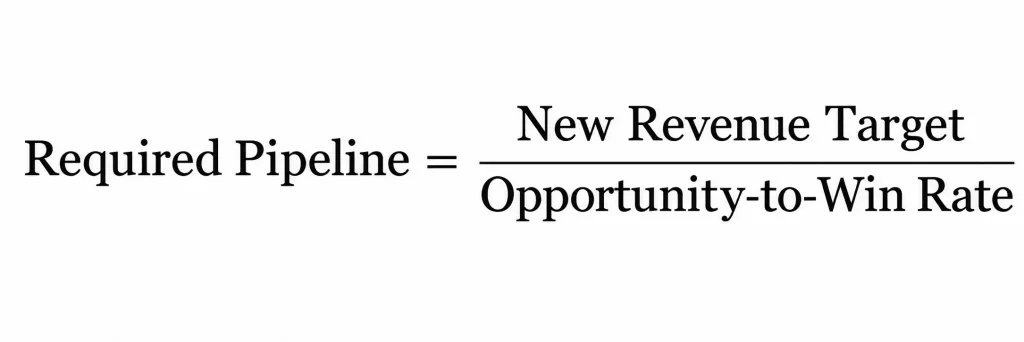
With a 25% win rate, a $3 million target needs $12 million in qualified pipeline. People often describe this as four-times coverage. The ratio is not a rule of thumb in this case; it follows directly from the win rate.
This works only if “opportunity” means something. Some sales teams open one after a promising first call. Others wait until they confirm a real project, fit, and buying process. Those businesses may report very different win rates even if their sales performance is similar. Fix the stage definition before letting it drive an eight-figure target.
Calculate the Funnel Volume
At an average opportunity value of $60,000, producing $12 million in pipeline requires 200 opportunities. If one in five sales-qualified leads becomes an opportunity, the plan needs 1,000 sales-qualified leads.
Not every company should use that sequence. An account-based team might model engaged accounts, qualified buying groups, and opportunities. A product-led company may track activated accounts and product-qualified leads. Choose the stages that reflect how customers actually buy, then use one definition consistently.
Mixing segments is another source of bad math. Enterprise deals take longer, cost more to win, and often convert differently from midmarket deals. When the differences are material, give each segment its own funnel and combine the forecasts at the end.
Put a Price on the Required Volume
Historical unit costs turn funnel volume into an investment estimate. If 200 opportunities are required and the fully loaded cost per opportunity is $6,000, the implied investment is $1.2 million.
Check the answer from another angle. A $24,000 blended customer acquisition cost multiplied by 50 customers also produces $1.2 million. The calculations will not always match perfectly, but a large gap deserves investigation. Perhaps software or salaries were omitted. Perhaps recent conversion has weakened. Perhaps the growth target assumes an efficiency improvement that no initiative is expected to deliver.
Top-down budgeting is still useful. It tells the team what the company can afford. The bottom-up model tells leaders what their target is likely to cost. Those answers may not match. In fact, they often do not.
If the business wants $3 million in new revenue but can fund only half the historically required investment, do not hide the mismatch inside optimistic conversion assumptions. Reduce the target, find a credible way to improve the economics, or state that the plan carries more risk. That conversation is uncomfortable, but cheaper than missing the number quietly.
How to Approach Marketing Budget Allocation
Once the total is clear, where should the money go? Start with what the business needs the investment to do, not how much LinkedIn or Google should receive.
One group should capture active demand through search, comparison content, review sites, and retargeting. Another should create future demand through original research, expert content, video, paid social, and category education. Events and partnerships may do both, especially in markets where trust and access to decision-makers matter more than raw reach.
The operating layer needs funding too: data, analytics, automation, attribution, and the people who hold the system together. Companies often cut these costs first because they do not appear to generate leads. Then reporting breaks, routing slows down, and sales loses confidence in the pipeline.
The 70-20-10 framework can help allocate spending by confidence level rather than by marketing channel. A single channel may include proven activity, scaling opportunities, and new tests.
A low cost per lead does not make a channel “proven.” Neither does a multi-touch report that gives every campaign credit for the same deal. Look at opportunity quality, pipeline value, movement through sales stages, and expected gross profit.
Marketing budget allocation also depends on the sale itself. A $200,000 enterprise product may justify executive dinners, account research, and tailored content. A lower-priced software product may lean more heavily on search, lifecycle messaging, and conversion work. There is no serious reason those two businesses should share the same percentage table.
How to Forecast Demand Generation ROI
How much value did the investment actually create? Revenue alone can flatter the result because it ignores delivery costs. Use gross profit instead:
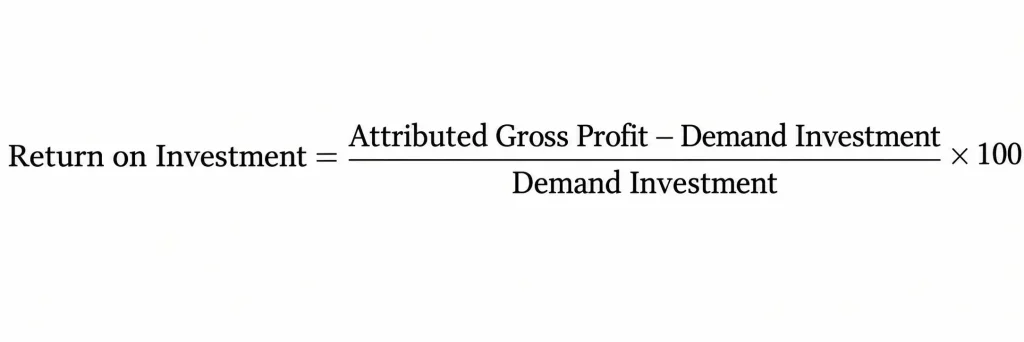
Suppose a program produces $2 million in attributable revenue at a 75% gross margin. That is $1.5 million in gross profit. If the associated investment was $600,000, the return is 150%:
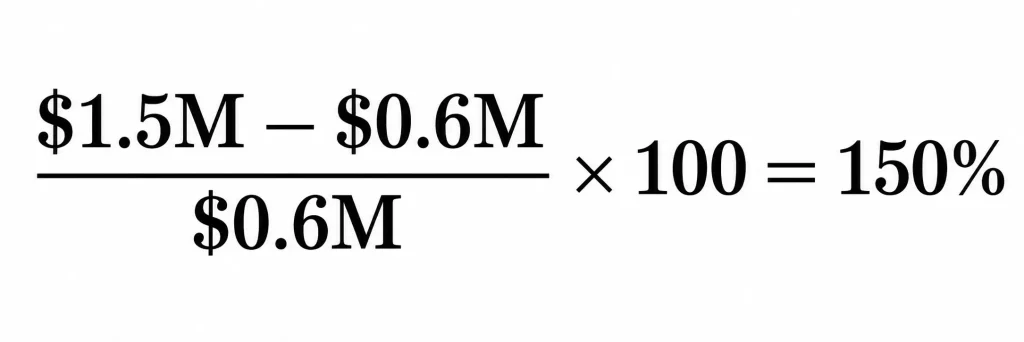
“Attributed” is where the argument usually begins. Marketing-sourced pipeline and marketing-influenced pipeline answer different questions. Sourced reporting asks where demand entered the measurable funnel. Influenced reporting recognizes that several interactions may shape a complex purchase. Report both if they help, but do not present every touched deal as revenue created independently by marketing.
Customer acquisition cost offers a second test:
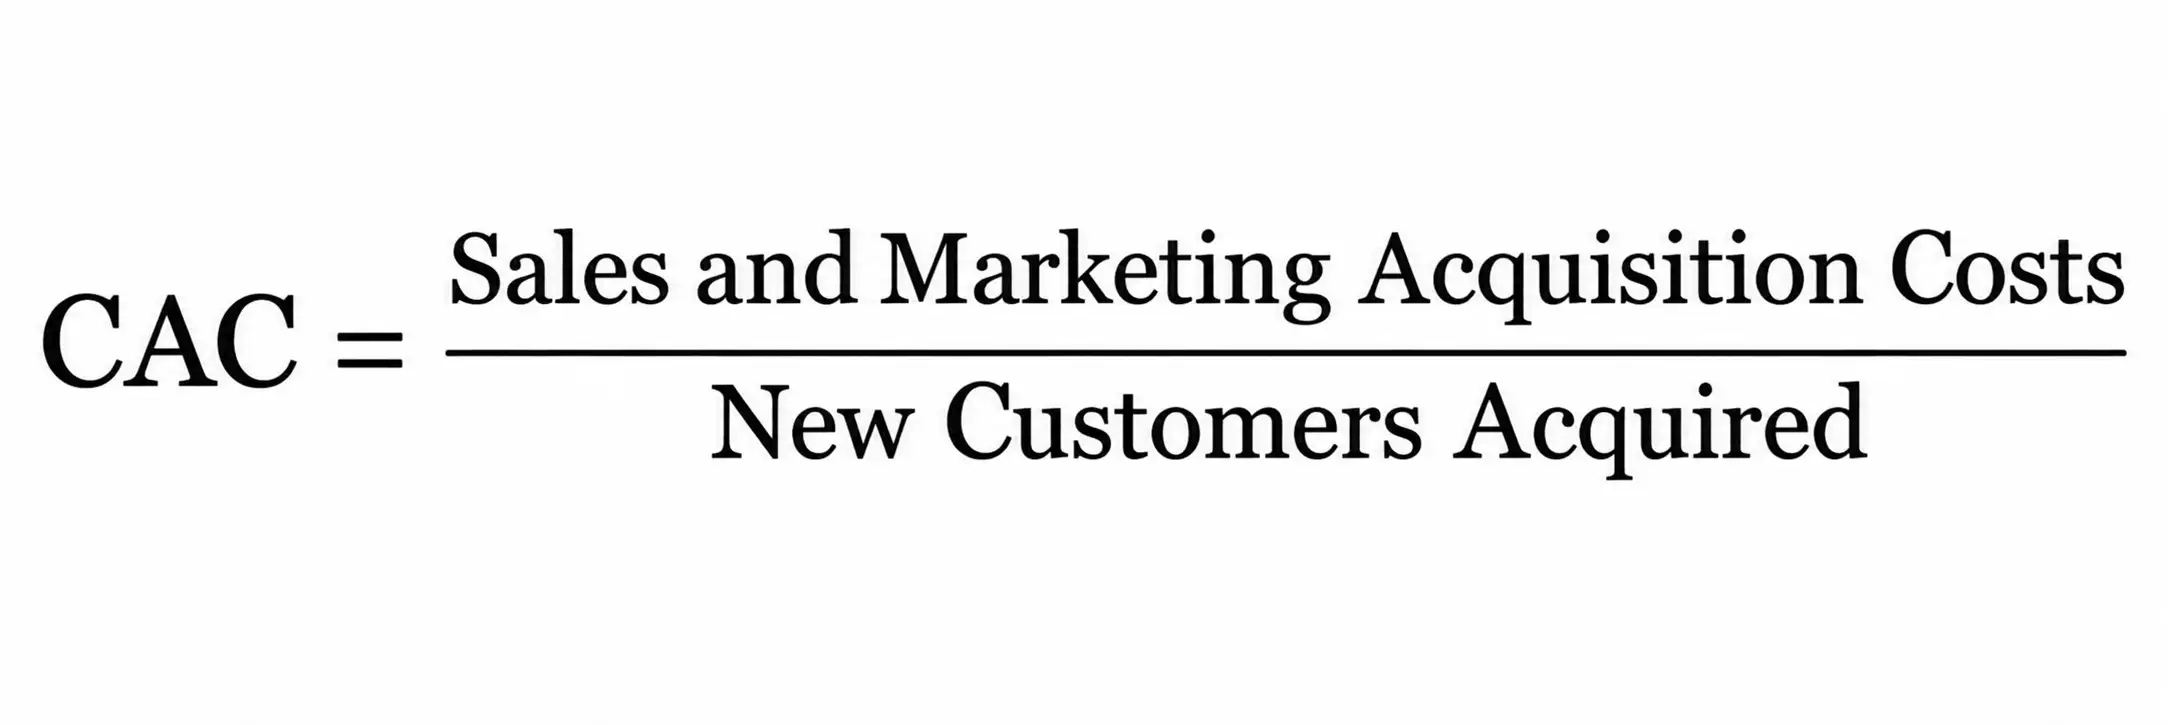
For blended CAC, include salaries, commissions, media, technology, data, content, events, agencies, and allocated overhead. If the calculation covers marketing costs only, call it marketing CAC. Small labeling choices prevent large misunderstandings in a finance meeting.
Timing matters just as much as attribution. A campaign can incur cost in January, create an opportunity in March, and produce revenue in July. Recording all three events in January makes the forecast look faster than the business really is. Recording the cost in January and demanding closed revenue in February makes a sound program look broken.
Track spend date, pipeline-creation date, and expected close date separately. Cohort reporting helps here: compare opportunities created in the same period and allow each cohort to mature according to the normal sales cycle. This is one of the less glamorous parts of demand generation planning, but it keeps short-term pressure from distorting long-cycle decisions.
A Worked Budget and Return Example
Take a software company seeking $2.4 million in new annual contract value. Its average contract is $60,000. It wins 25% of qualified opportunities, and 20% of sales-qualified leads become opportunities.
| Input or output | Calculation | Result |
|---|---|---|
| New revenue target | Planning target | $2,400,000 |
| Average contract value | Historical average | $60,000 |
| Customers required | $2.4M ÷ $60,000 | 40 |
| Opportunity-to-win rate | Historical conversion rate | 25% |
| Qualified pipeline required | $2.4M ÷ 25% | $9,600,000 |
| Opportunities required | $9.6M ÷ $60,000 | 160 |
| SQL-to-opportunity rate | Historical conversion rate | 20% |
| Sales-qualified leads required | 160 ÷ 20% | 800 |
| Assumed blended CAC | Historical acquisition cost | $24,000 |
| Fully loaded acquisition investment | $24,000 × 40 customers | $960,000 |
| Gross margin | Financial assumption | 75% |
| Attributable gross profit | $2.4M × 75% | $1,800,000 |
| Forecast return | (($1.8M − $960K) ÷ $960K) × 100 | 87.5% |
Two operating thresholds fall out of the model: $24,000 per acquired customer and $6,000 per opportunity. Those numbers give the quarterly review some teeth.
If opportunities cost $8,000 after two quarters, the team cannot simply point to engagement and ask for patience. It must identify a believable path to better conversion, reduce acquisition cost, or lower the revenue forecast. If opportunity cost falls below $5,000 and sales confirms that quality holds, releasing part of the reserve may be justified.
One forecast is not enough. Build a conservative case, a base case tied to recent performance, and an upside case that names what must improve. A range admits what everyone already knows: forecasts are estimates. A single perfect-looking number is mostly theater.
How to Monitor and Adjust the Plan
How often should you review the plan? Monthly is useful, but not every metric matures at the same speed.
Early signals include target-account engagement, qualified replies, meeting quality, and new opportunities. Later evidence includes pipeline progression, win rate, CAC, gross profit, and realized return. Lead volume sits somewhere in the middle and can be dangerously comforting. A database can grow while revenue stands still.
Decide the reallocation rules before anyone becomes attached to a campaign. Review spend and funnel movement each month, then make the larger calls quarterly. Keep 5% to 10% uncommitted. Release it when a program earns more money, not when its owner makes the loudest case.
The same standard applies when a demand generation agency runs part of the program. Reports should reveal the economics, not bury them under activity counts. Ask which assumption changed, what evidence supports the change, and what decision follows.
Long sales cycles require patience, not immunity. A six-month sales process should not be judged on 30-day revenue. It should still produce the leading indicators expected at 30, 60, and 90 days. If those signals never appear, “long term” becomes an excuse rather than a strategy.
Conclusion
Good demand generation planning does not remove uncertainty. Nothing does. Its value is more practical: it stops the company from dressing up a guess as a plan.
Work backward from revenue. Price the customer and pipeline volume required. Fund the machinery behind the campaigns, not just the media. Then judge progress on the timeline buyers actually follow.
The result is more than a marketing spreadsheet. It is a commercial argument that leadership can challenge: this is the investment, this is the expected pipeline, these are the assumptions, and these are the decisions we will make if performance moves off plan. Companies that lack the internal capacity to build or run that system can use specialized B2B demand generation services to add strategy, execution, and measurement discipline without constructing the full team at once.